
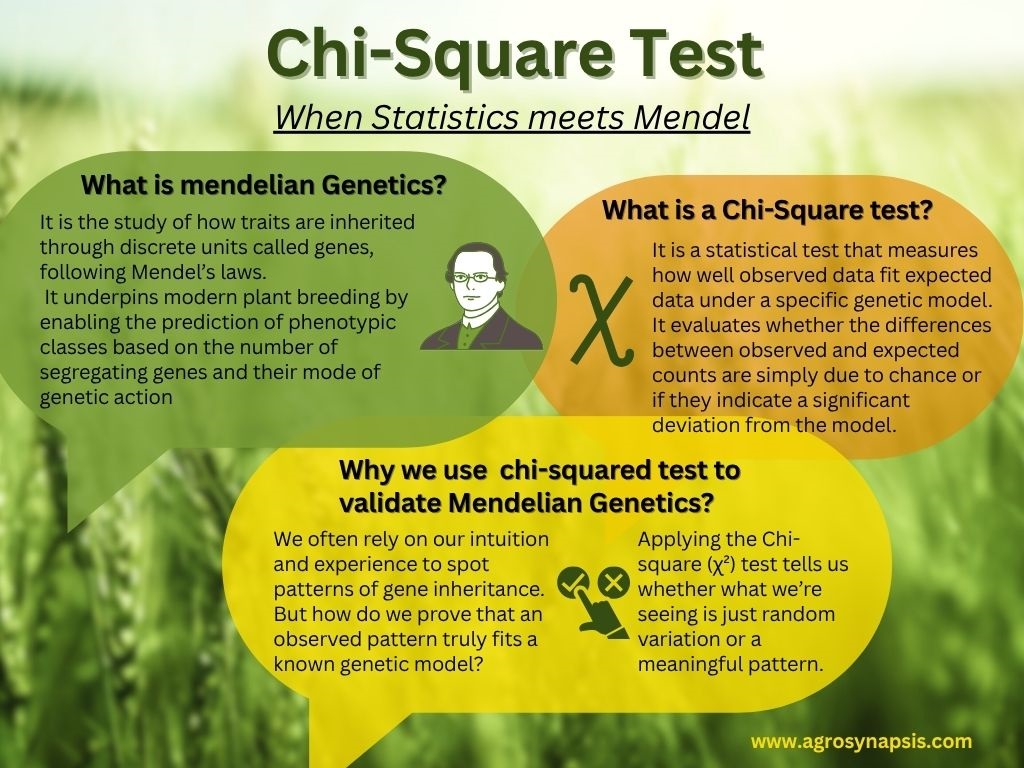
As breeders or geneticists, we often rely on our intuition and experience to spot patterns—like how a trait might be inherited. But how do we prove that an observed pattern truly fits a known genetic model, like the classic 3:1 Mendelian ratio taught in every genetics class?
This is where statistics becomes our ally. Applying a tool like the Chi-square (χ²) test allows us to move from a gut feeling to a statistically sound conclusion. It tells us whether what we’re seeing is just random variation or a meaningful pattern.
📖The Theory
𝗧𝗵𝗲 𝗖𝗵𝗶-𝘀𝗾𝘂𝗮𝗿𝗲 (χ²) 𝘁𝗲𝘀𝘁 𝗶𝘀 𝗮 𝘀𝘁𝗮𝘁𝗶𝘀𝘁𝗶𝗰𝗮𝗹 𝗵𝘆𝗽𝗼𝘁𝗵𝗲𝘀𝗶𝘀 𝘁𝗲𝘀𝘁 𝘁𝗵𝗮𝘁 𝗺𝗲𝗮𝘀𝘂𝗿𝗲𝘀 𝗵𝗼𝘄 𝘄𝗲𝗹𝗹 𝗼𝗯𝘀𝗲𝗿𝘃𝗲𝗱 𝗱𝗮𝘁𝗮 𝗳𝗶𝘁 𝗲𝘅𝗽𝗲𝗰𝘁𝗲𝗱 𝗱𝗮𝘁𝗮 𝘂𝗻𝗱𝗲𝗿 𝗮 𝘀𝗽𝗲𝗰𝗶𝗳𝗶𝗰 𝗴𝗲𝗻𝗲𝘁𝗶𝗰 𝗺𝗼𝗱𝗲𝗹. It evaluates whether the differences between observed and expected counts are simply due to chance or if they indicate a significant deviation from the model.
The test operates by comparing the squared difference between observed and expected values, scaled by the expected value, summed over all categories. The resulting χ² value is then compared to a critical value from the Chi-squared distribution table, based on the degrees of freedom and desired confidence level.
🍇 A Practical Example: Fruit Color in the F2 Generation
Imagine you’re analyzing the F2 generation from a cross in fruit plants, where purple is dominant over yellow. You expect a Mendelian 3:1 ratio.
In a population of 800 fruits, that means:
Expected: 600 purple, 200 yellow
Observed: 580 purple, 220 yellow
Is the deviation significant?
We calculate the Chi-square statistic:
χ² = Σ((O − E)² / E)
🧮 Result: 2.67
Degrees of freedom = 1
Critical value at 5% significance level = 3.841
Since 2.67 < 3.841, the deviation is not statistically significant. We do not reject the null hypothesis, meaning the observed distribution is consistent with Mendelian inheritance.
✅ Conclusion: Your intuition was right—but now it’s backed by data.
📌 At AgroSynapsis, we’ve developed a free online tool (EpiTRack) that helps breeders quickly run this analysis. Just paste your raw phenotypic data, and the tool automatically identifies the best fit model.