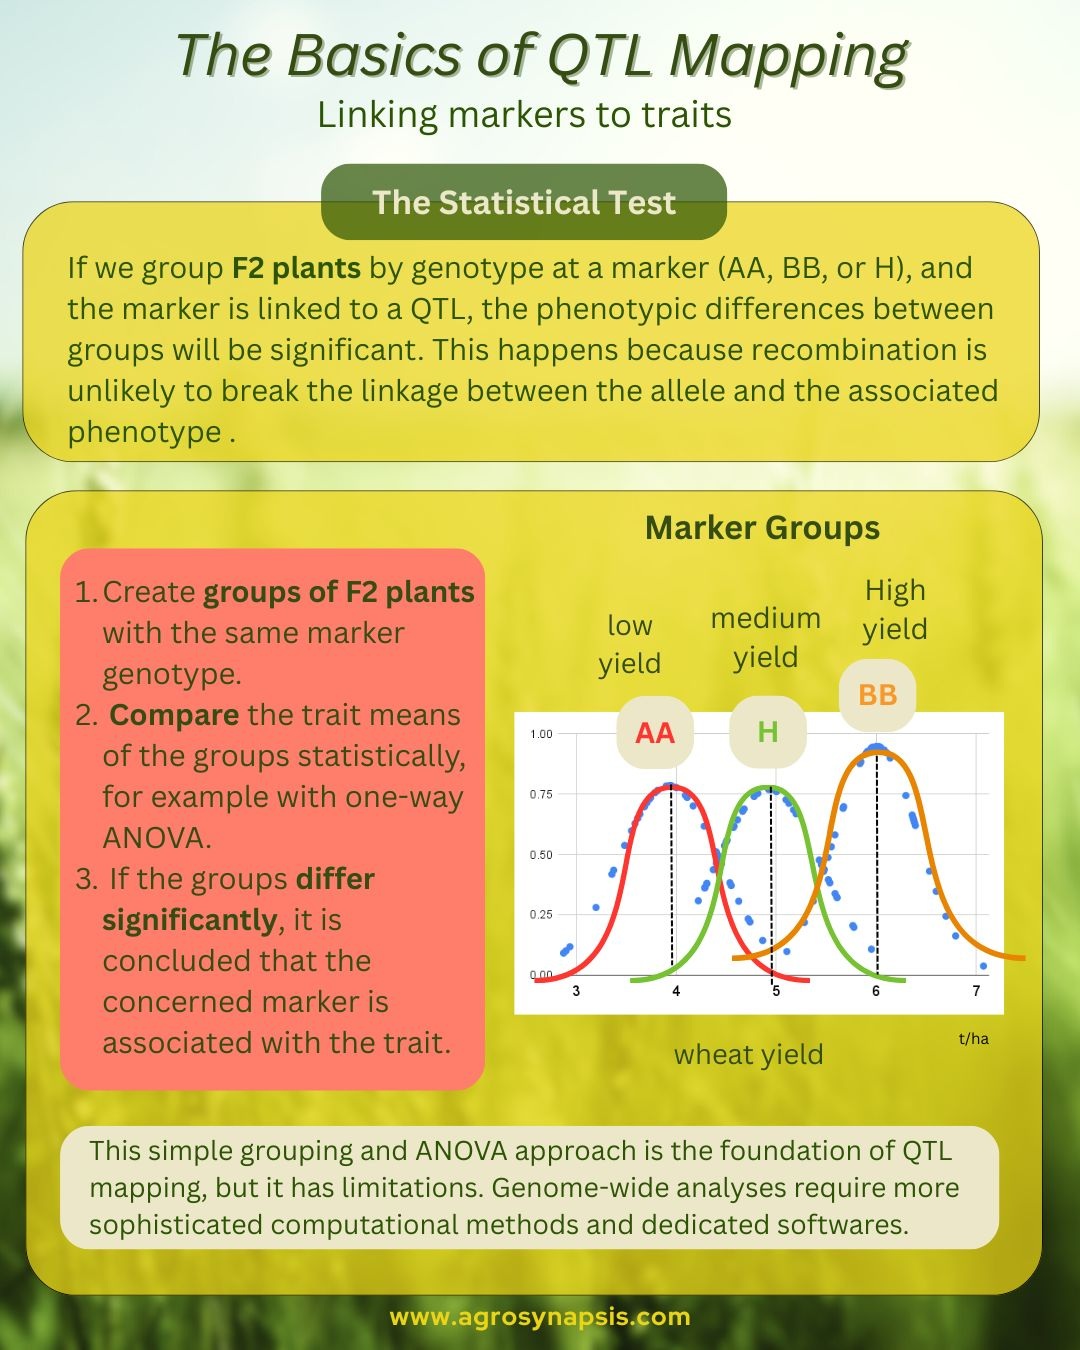
When we talk about QTL mapping, we are essentially trying to answer a simple question: Is a region of the genome associated with a trait of interest? Let’s take an F2 wheat population segregating for yield as an example.
Here are the logical step we take:
1️⃣Group plants by genotype at a marker.
For each molecular marker, F2 plants can be grouped as AA, BB, or heterozygous (AB).
2️⃣ Calculate the mean trait value for each genotypic group.
For example, you calculate the average yield of all AA plants, all BB plants, and all AB plants.
3️⃣ Test the differences with ANOVA.
If the differences between these means are statistically significant, we infer that a QTL is likely present near that marker.
💡Why does this work? It’s all about linkage and recombination.
Markers close to a QTL are usually inherited together with it. So, if we group F2 plants by genotype at a marker (AA, BB, or H), and the marker is linked to a QTL, the phenotypic differences between these groups will be significant. For example, most plants of genotype AA will have significantly higher yield than the plants of genotype BB because the allele A is connected to the allele of high yield.
4️⃣ Repeat for all markers.
Each marker is tested independently, which gives a genome-wide picture of where QTLs may be located. This is the most basic approach, often called single-factor ANOVA. More sophisticated QTL mapping methods refine the statistics to handle multiple QTLs, complex populations, and marker interactions.
⚠️ Limitations to keep in mind:
->The further a QTL is from a marker, the less likely it will be detected because recombination may separate them. This can underestimate the effect of the QTL.
Using a dense set of markers across the genome (typically <15 cM apart) can minimize this problem.
->QTL positions are estimated relative to markers, so exact locations remain imprecise.
A practical tip for breeders:
📝This simple ANOVA-based approach is a perfect and straightforward way to validate existing markers for your traits in a mapping population. We will show how to run this test in detail in another post. Even at this stage, it gives breeders a quick way to check which markers are truly linked to important traits before moving to more complex analyses.
✨ At AgroSynapsis, we offer training workshops and coaching on topics of molecular breeding, explaining complex concepts with clarity and simplicity.
👉 If you’d like to be informed about our upcoming workshops, and receive early access and discounts, 𝗳𝗶𝗹𝗹 𝗼𝘂𝘁 𝗼𝘂𝗿 𝘀𝗵𝗼𝗿𝘁 𝘁𝗿𝗮𝗶𝗻𝗶𝗻𝗴 𝗶𝗻𝘁𝗲𝗿𝗲𝘀𝘁 𝗳𝗼𝗿𝗺 here:
https://lnkd.in/g3tApqPz
Understanding the Basics of QTL Mapping: linking markers to traits

by

