-
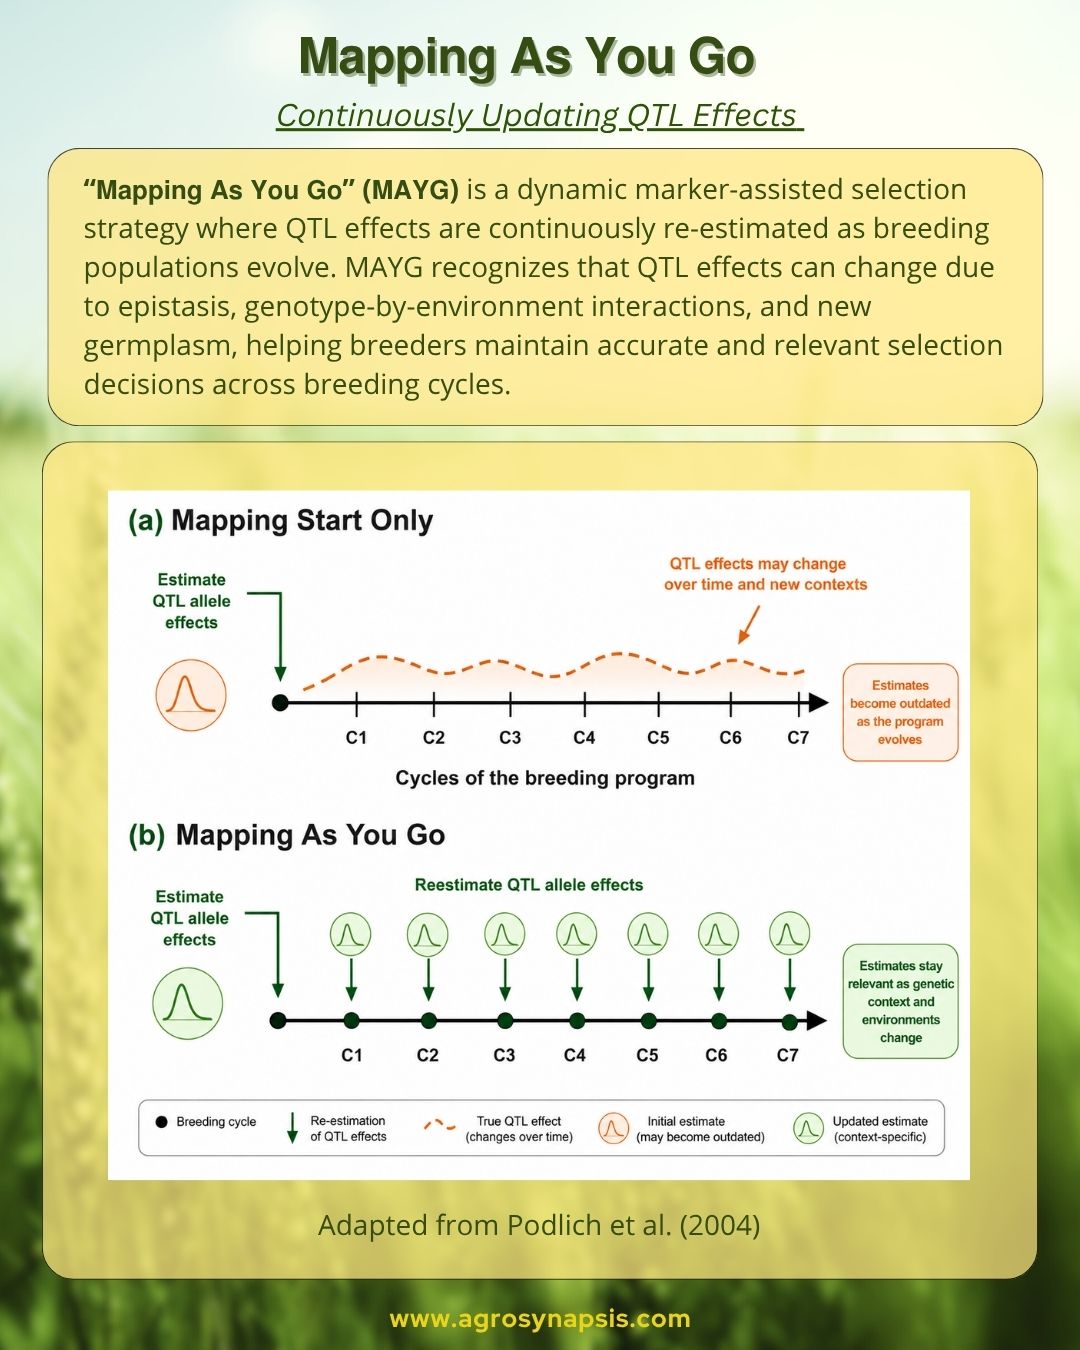
Mapping As You Go (MAYG)
Read more: Mapping As You Go (MAYG)Marker-assisted selection for complex traits should not rely on static QTL estimates. The “Mapping As You Go” (MAYG) approach continuously re-estimates QTL effects as breeding populations evolve, accounting for epistasis and genotype-by-environment interactions. By updating marker information across breeding cycles, breeders can maintain more accurate and biologically relevant selection decisions.
-
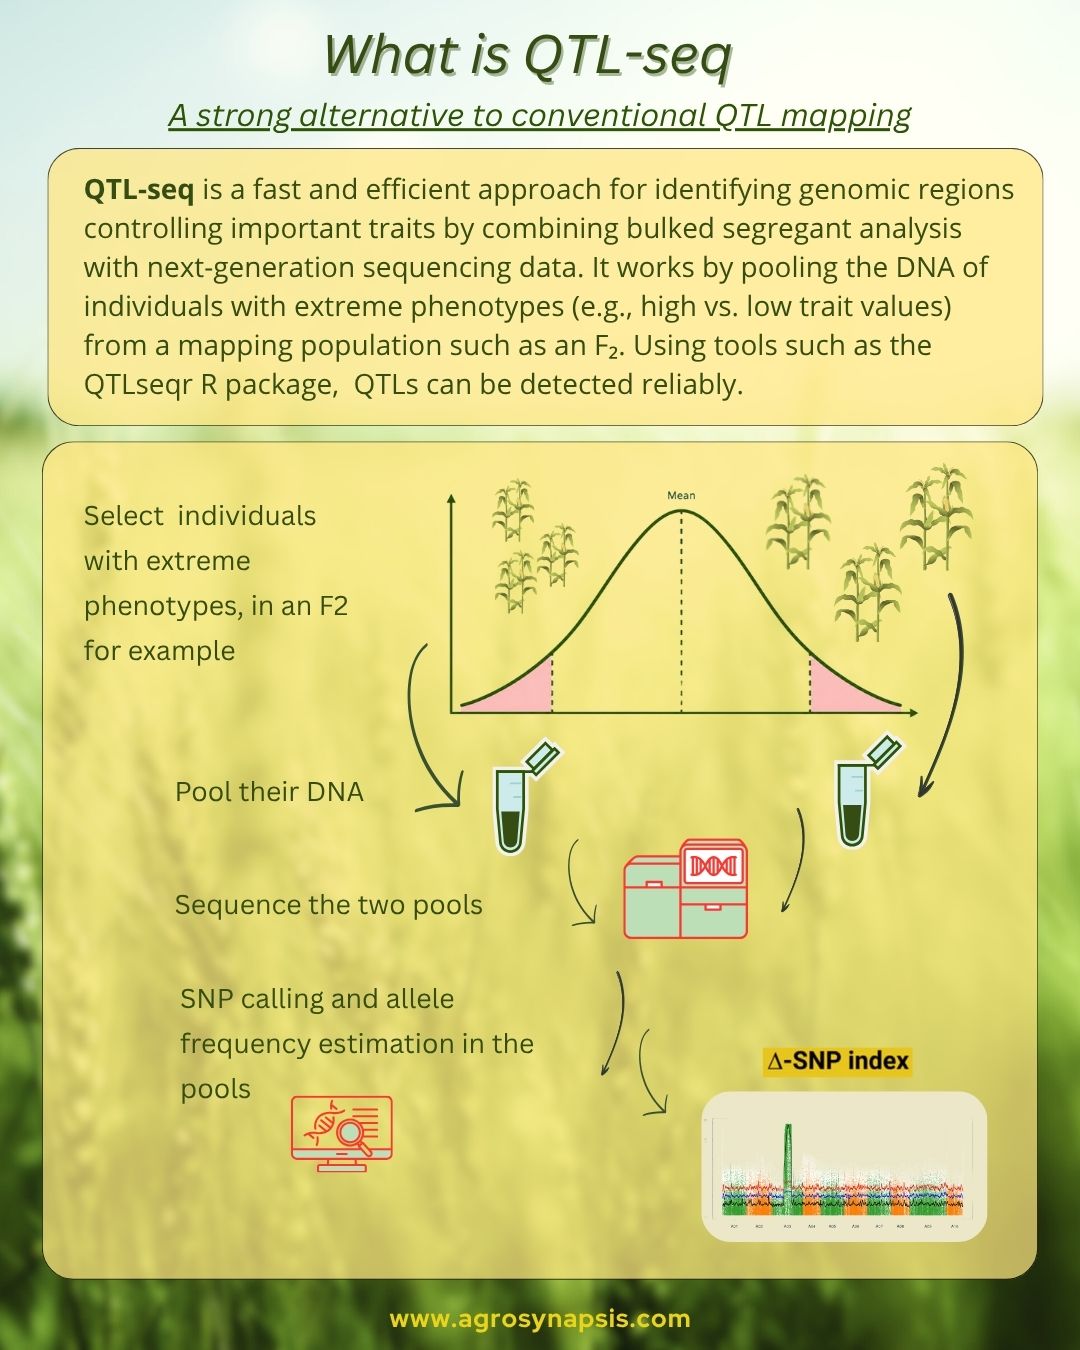
QTL-seq: A fast, precise, and cost-effective alternative to biparental QTL mapping for breeding companies
Read more: QTL-seq: A fast, precise, and cost-effective alternative to biparental QTL mapping for breeding companiesDiscover how QTL-seq combines bulk segregant analysis and sequencing to rapidly identify trait-linked genomic regions with high precision and low cost.
-
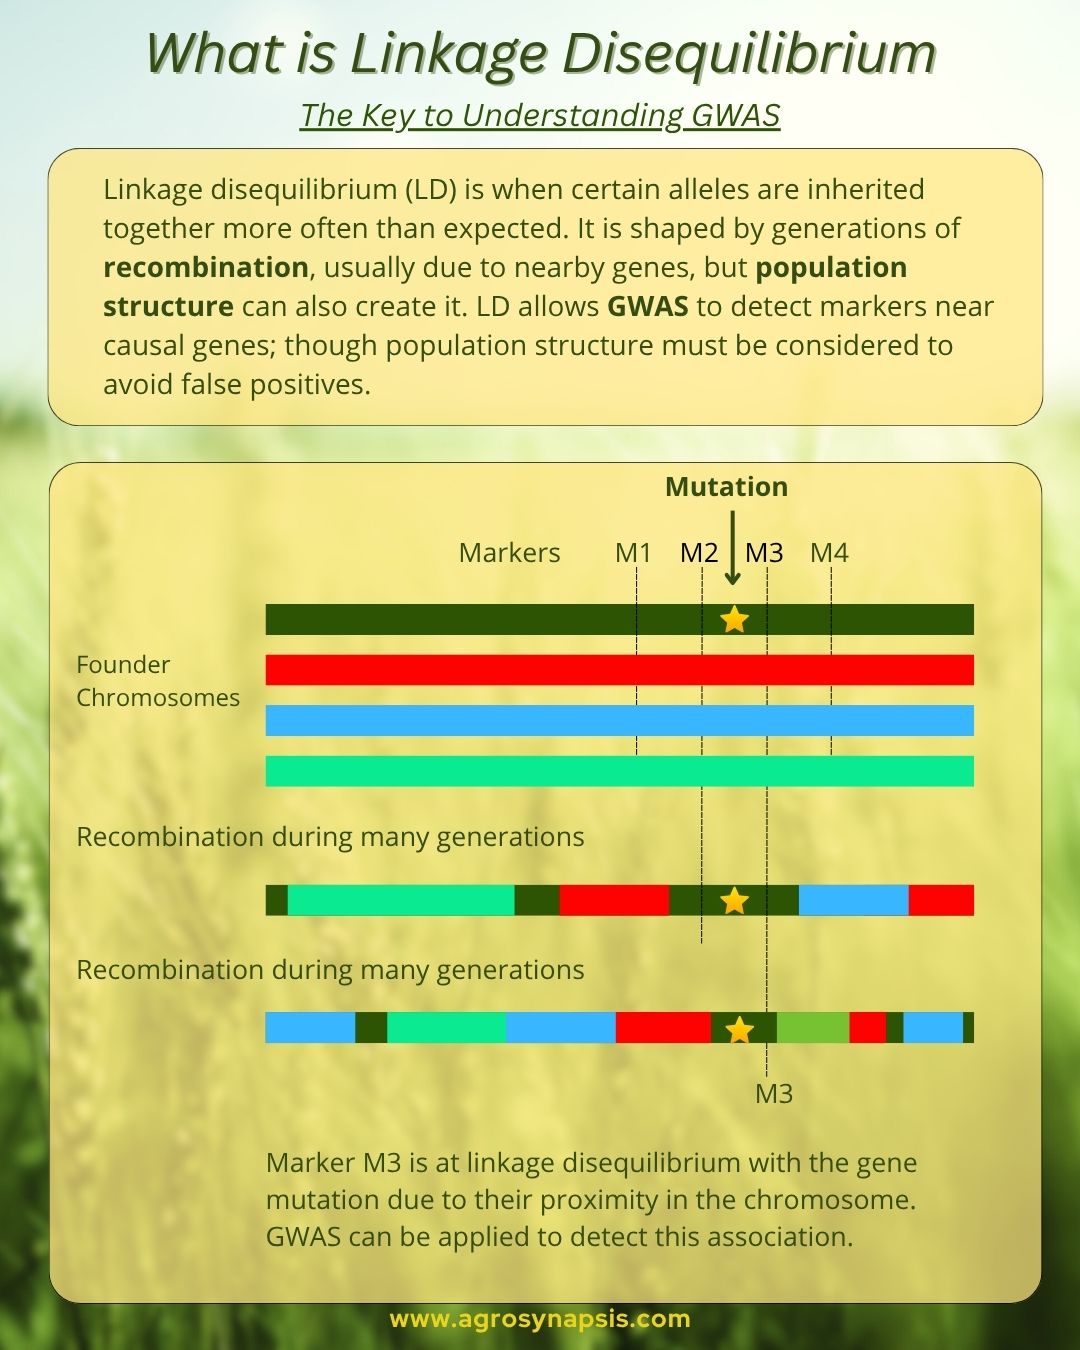
Linkage Disequilibrium in Breeding: From Alleles to GWAS Signals
Read more: Linkage Disequilibrium in Breeding: From Alleles to GWAS SignalsDiscover how linkage disequilibrium drives GWAS and why population structure can create misleading associations if not properly controlled.
-
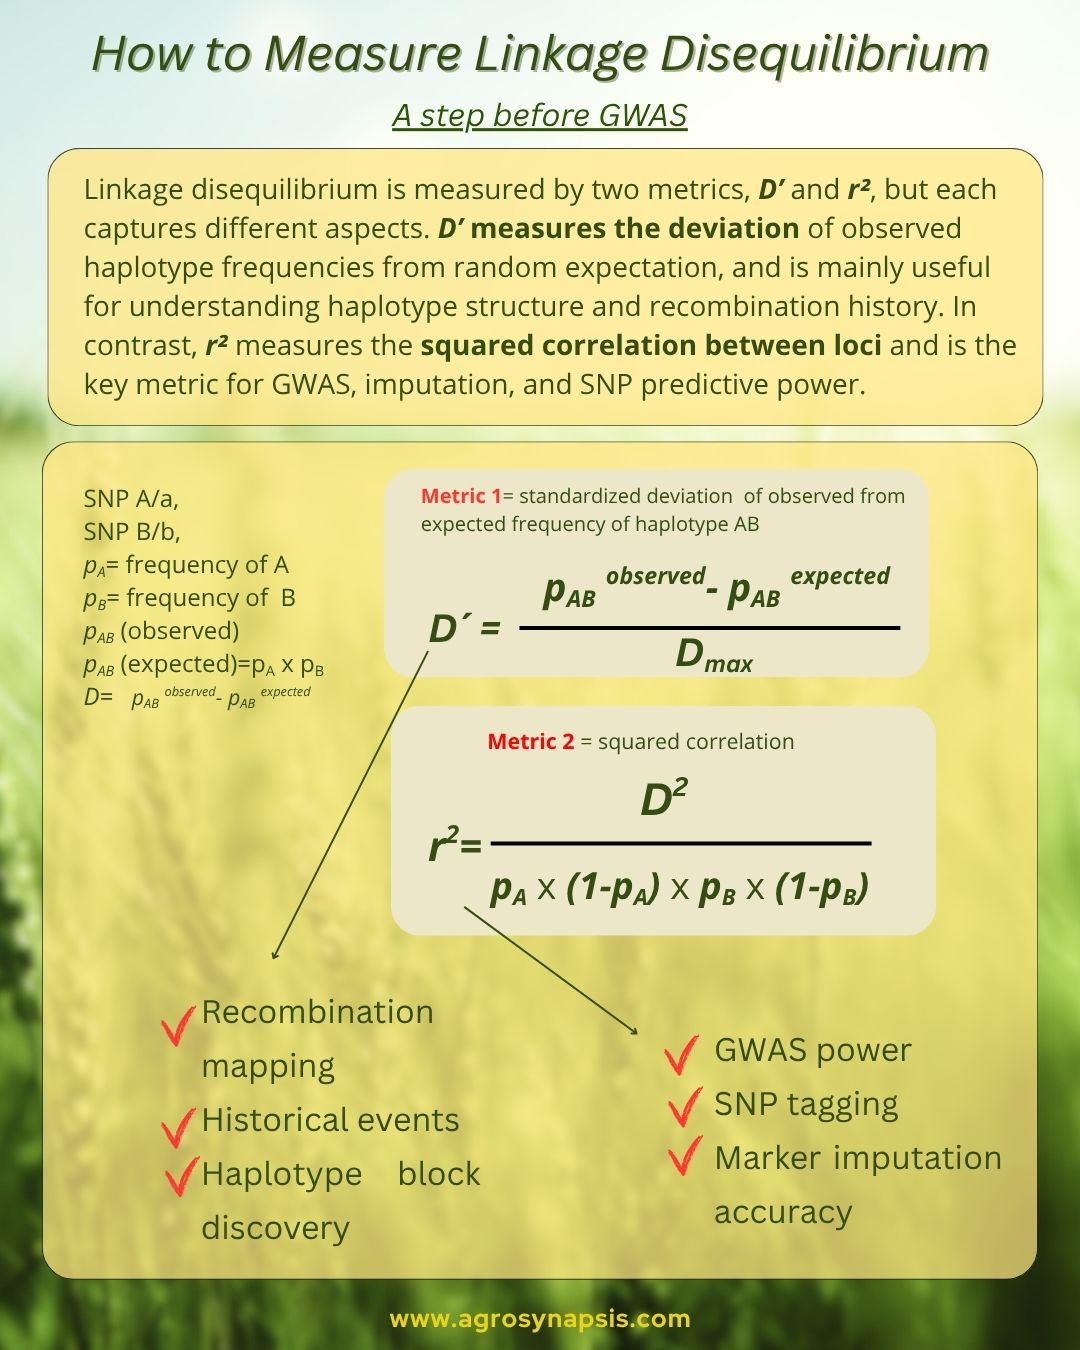
How do we measure Linkage Disequilibrium (LD) in practice?
Read more: How do we measure Linkage Disequilibrium (LD) in practice?Discover how linkage disequilibrium is measured and why r²—not D—is the key metric behind GWAS signal detection.
-
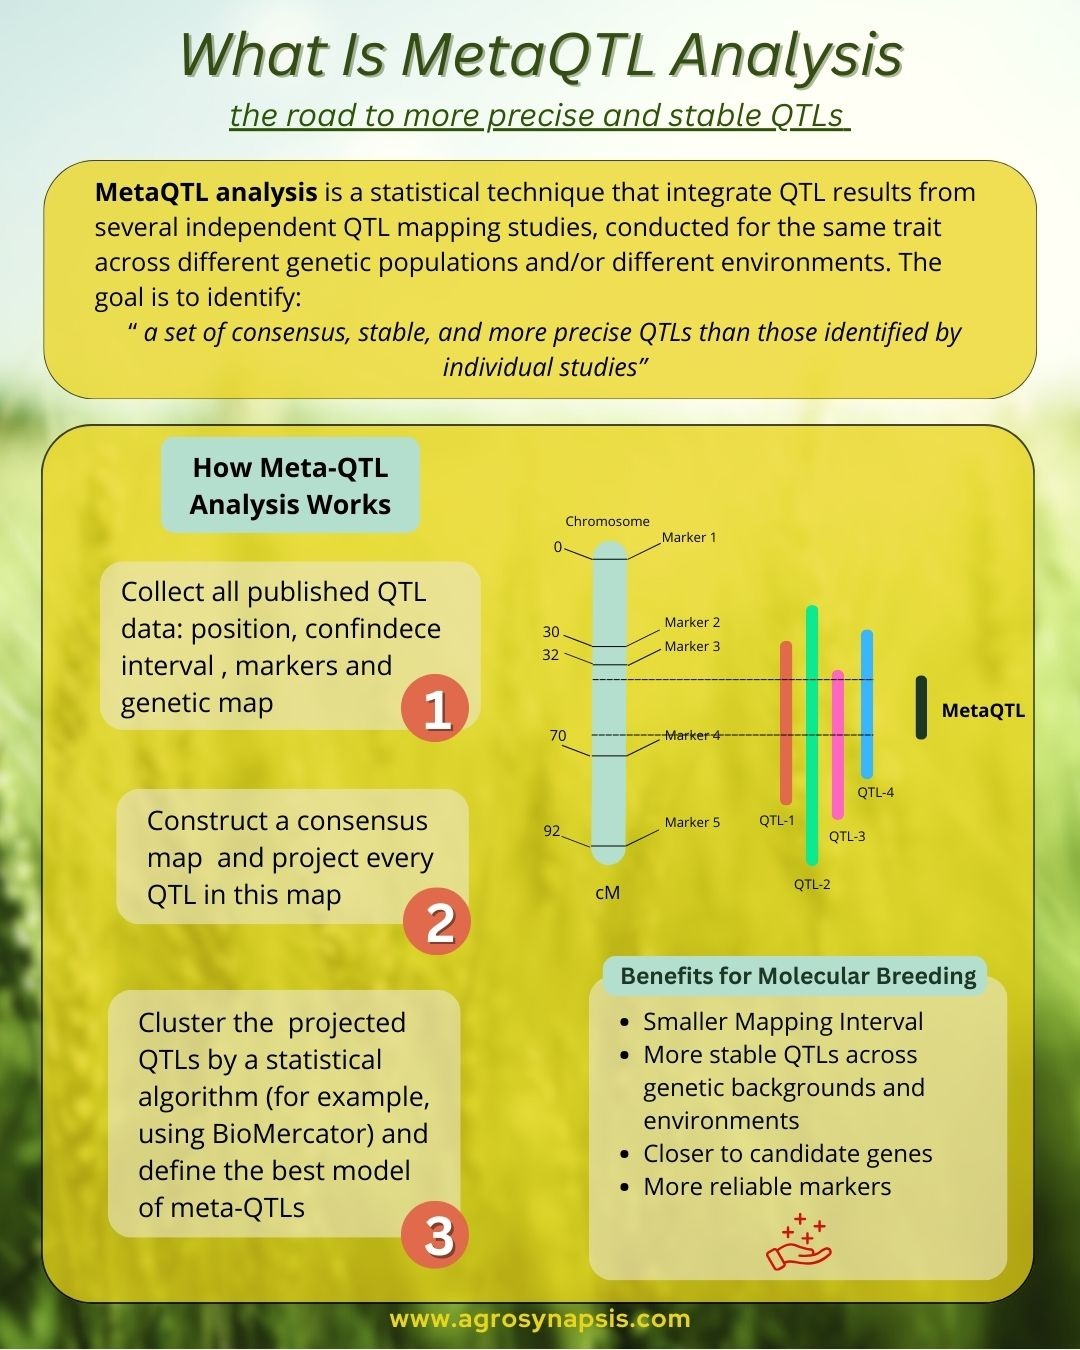
What It is and Why Meta-QTL Analysis Is a Breakthrough for Plant Breeders
Read more: What It is and Why Meta-QTL Analysis Is a Breakthrough for Plant BreedersDiscover how Meta-QTL analysis transforms scattered QTL results into stable, high-confidence genomic regions, helping breeders identify reliable markers for selection.
-
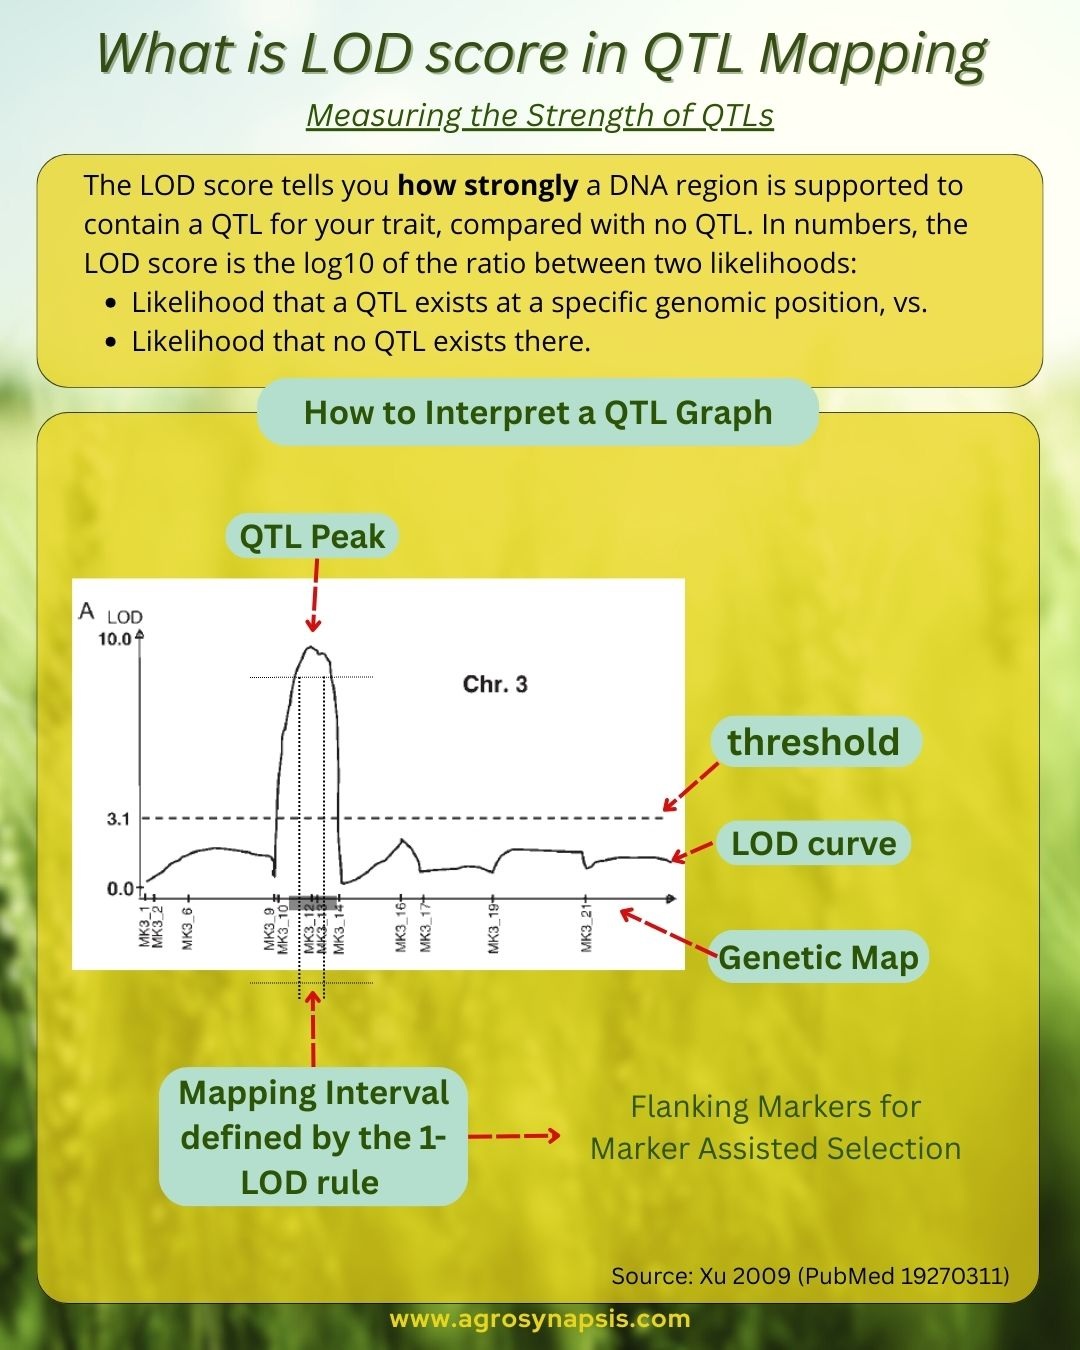
What It Is and How to Interpret LOD Score in QTL Mapping
Read more: What It Is and How to Interpret LOD Score in QTL MappingFind out how the LOD score helps detect QTLs across the genome and guides the selection of accurate marker regions for breeding decisions.
-
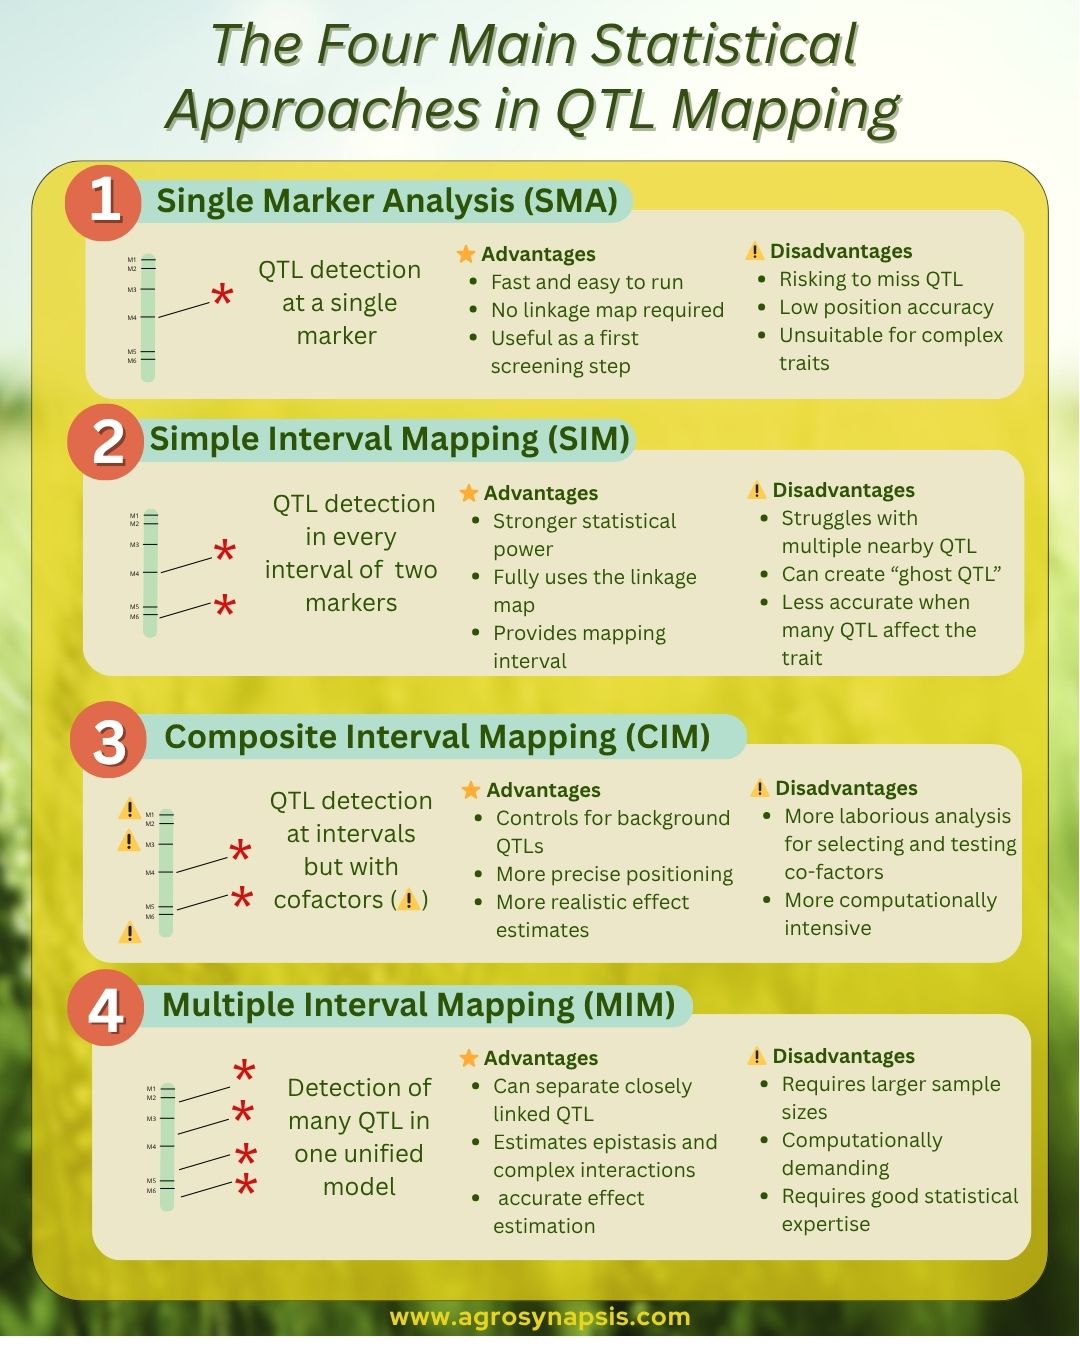
The Four Main Statistical Approaches in QTL Mapping
Read more: The Four Main Statistical Approaches in QTL MappingQTL mapping has evolved significantly over the last 30 years. Each method—from simple single-marker tests to multi-QTL models—represents a step forward in power, resolution, and biological insight. Here is a practical overview for everyone who want to understand how these methods work and what each can (and cannot) do.
-
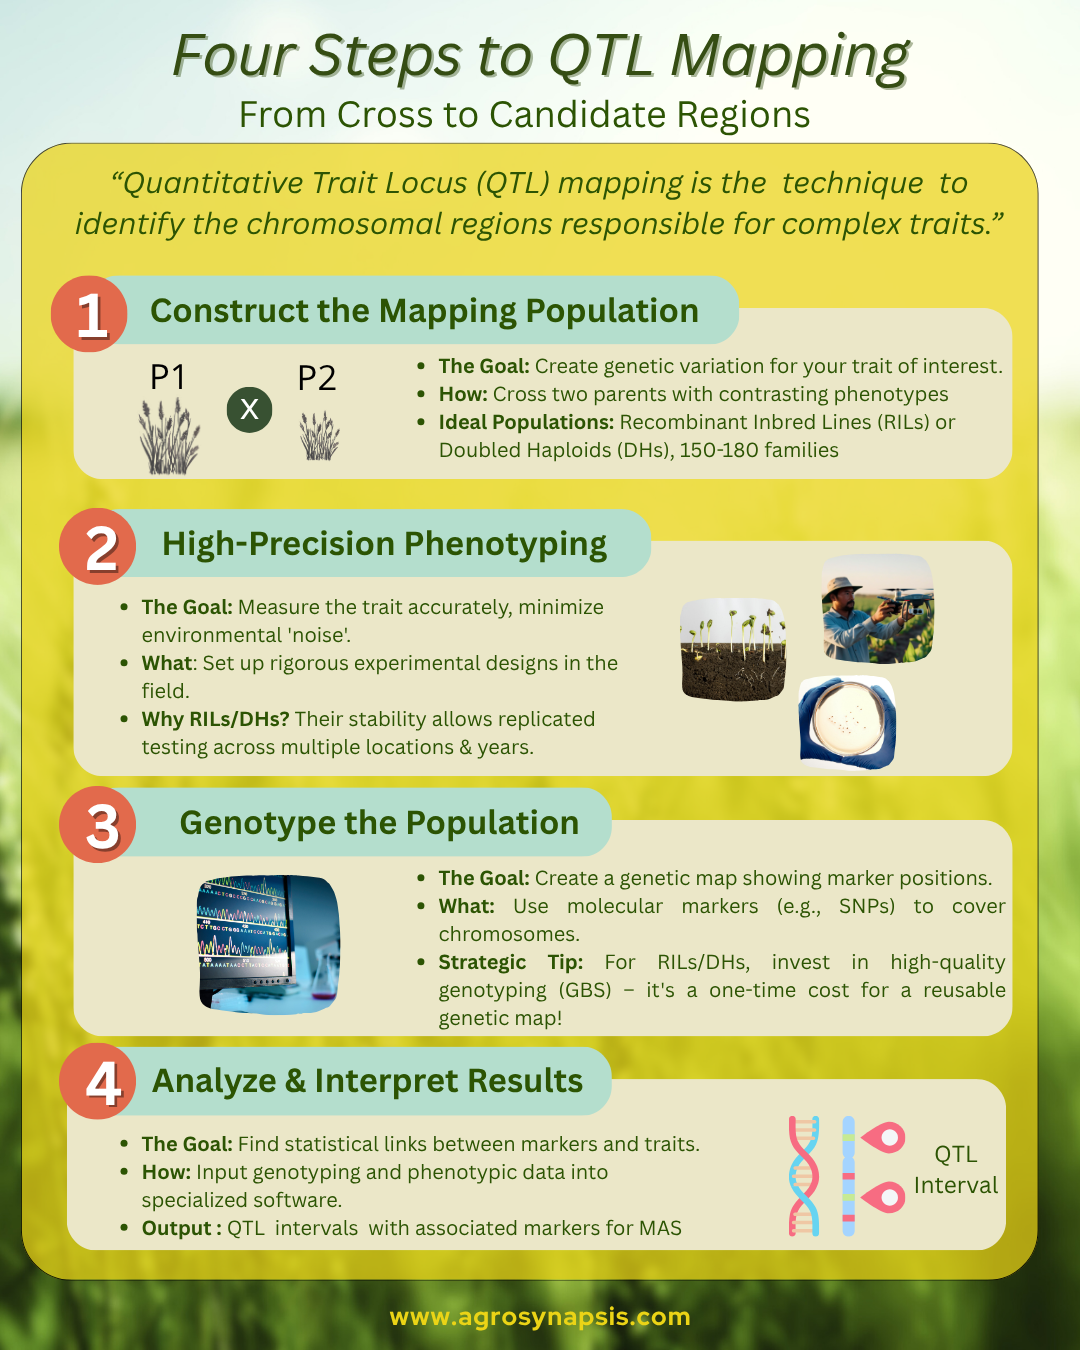
Four Steps to Detect QTLs: From Cross to Candidate Regions
Read more: Four Steps to Detect QTLs: From Cross to Candidate RegionsQuantitative Trait Locus (QTL) mapping allows breeders to identify genomic regions controlling complex traits. Here’s a short roadmap of the key steps to get reliable results:
-
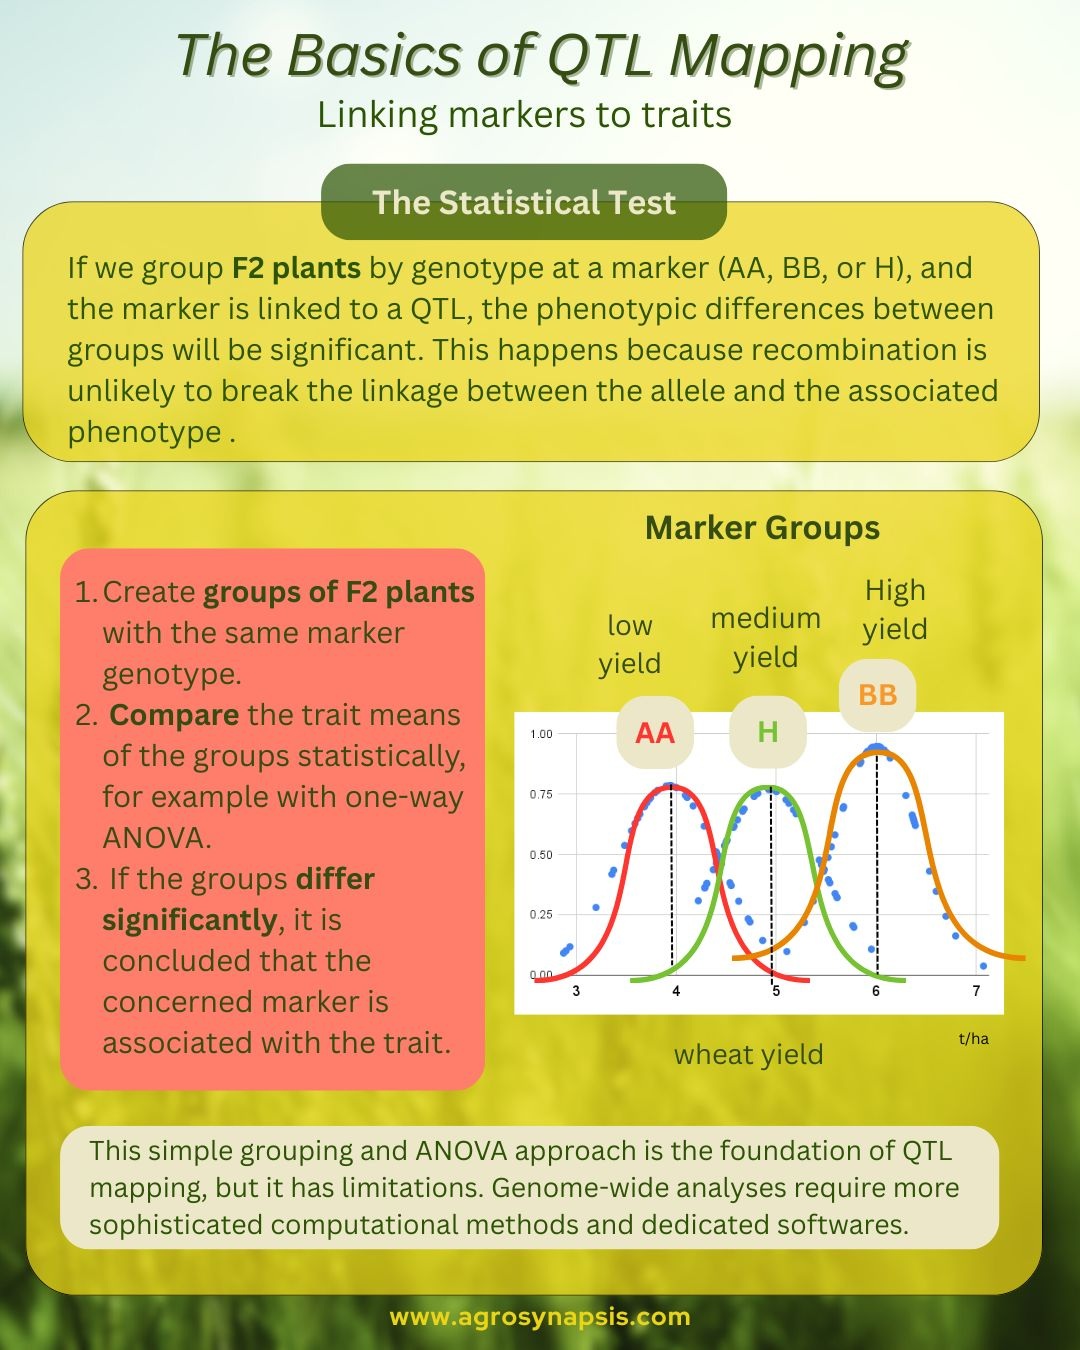
Understanding the Basics of QTL Mapping: linking markers to traits
Read more: Understanding the Basics of QTL Mapping: linking markers to traitsDiscover the basic logic behind QTL mapping


Molecular breeding consulting and training for seed companies, universities, researchers, and agtech professionals.