
As QTL mapping progressed—from single-marker analysis to Simple Interval Mapping (SIM) and later Composite Interval Mapping (CIM)—a new and powerful statistic became central to detecting quantitative trait loci:
✨ the LOD score (Logarithm of the Odds).
This metric revolutionized QTL detection in 90s by allowing us to test not only at marker positions, but also between them, giving breeders a much more precise view of where trait-controlling loci are located.
🔍 What Exactly Is the LOD Score?
The LOD score is a statistical metrics: it measures how strong is the evidence that a QTL is present in a specific genomic position.
At any position in the genome, the LOD score compares:
👉 The likelihood that a QTL is located at this position
vs.
👉 The likelihood that no QTL is there (i.e., the position is unlinked)
This ratio is expressed in log10 form in order to obtain a smooth curve.
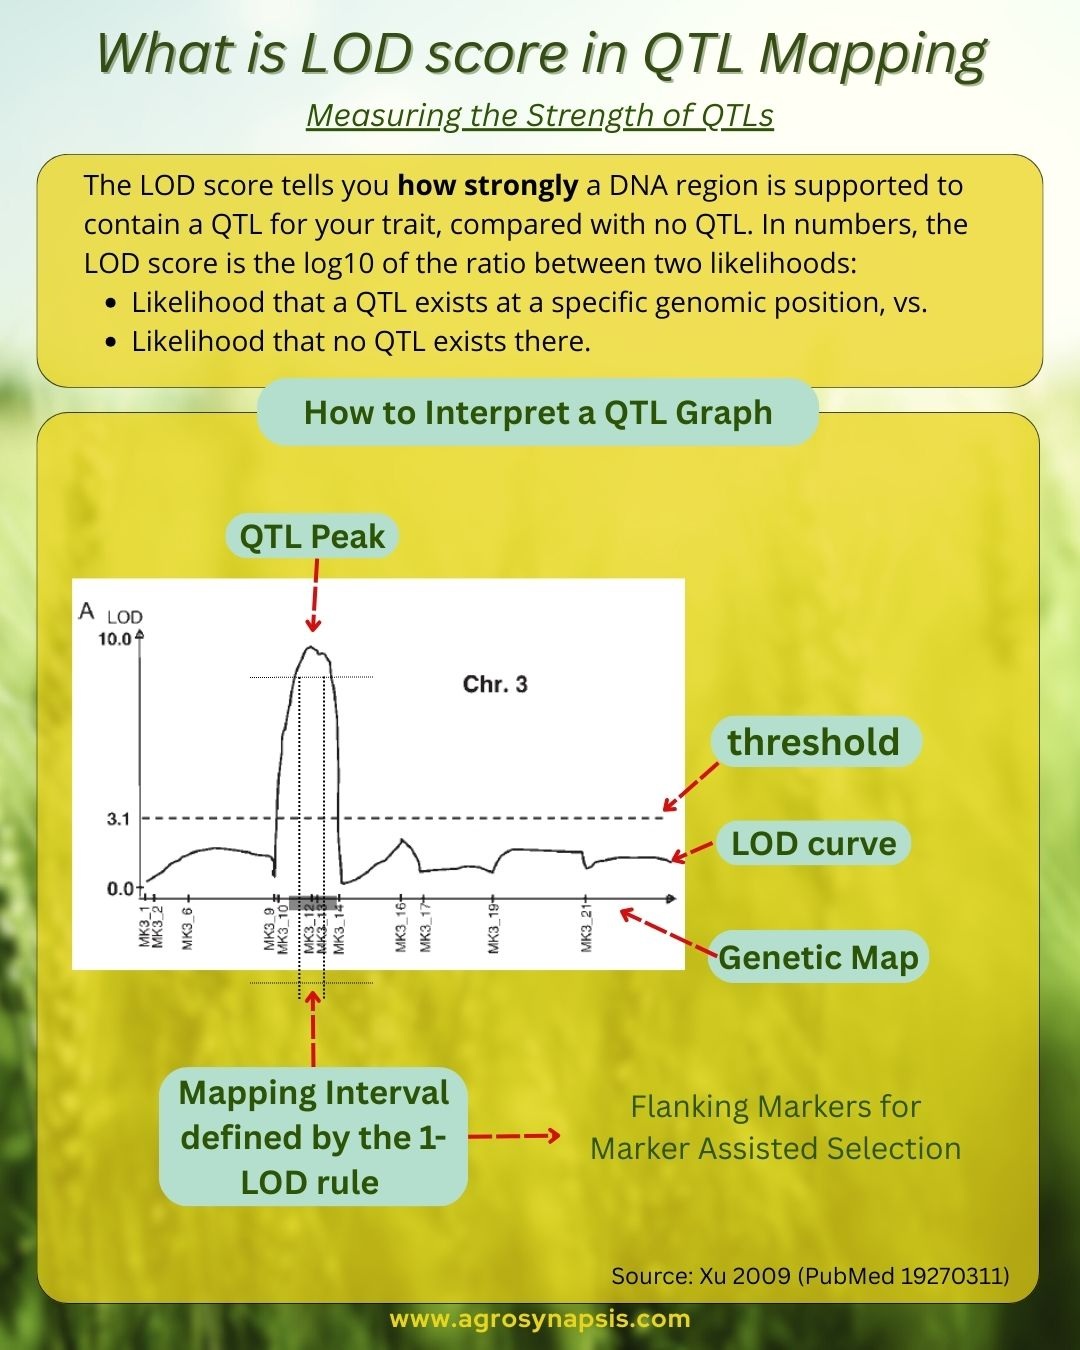
During QTL analysis, the software calculates the LOD score at regular intervals (e.g., every 1–2 cM) along the chromosome. These values are plotted to create a continuous LOD curve that shows how the evidence for a QTL changes across the genetic map and highlights the positions where QTL peaks appear.
📌 What does a LOD value mean in practical terms?
A LOD score of 3 between two markers indicates that linkage is 1000 times more likely than no linkage—a 1000:1 odds ratio.
This is why a LOD threshold of ~3 is commonly used as evidence for declaring a QTL.
📈 What Information Does the LOD Score Provide?
The magnitude of the LOD score informs us about:
Whether a QTL is likely present (LOD ≥ 3 is a common significance threshold)
How strong the evidence is (LOD > 6–10 often indicates a major QTL)
Where the QTL is positioned on the chromosome (the peak of the LOD curve)
The highest point of the LOD curve marks the most probable location of the QTL.
🎯 The ±1 LOD Rule: Defining the QTL Interval for Marker-Assisted Selection
To apply a QTL in marker-assisted selection (MAS), we need to identify the markers that flank the QTL with confidence.
This is done using the 1-LOD support interval (also known as a confidence interval for QTL location):
How it works:
Find the peak LOD value.
Move left and right along the chromosome until the LOD drops by 1 unit from the peak.
The region between these two points defines the mapping interval.
The nearest markers at each boundary are the flanking markers recommended for MAS.
Understanding the LOD score helps:
✔ Identify significant QTLs
✔Separate major from minorQTLs
✔ Choose reliable flanking markers for MAS
👉 If you’d like to be informed about the upcoming workshops organized by AgroSynapsis, and receive early access and discounts, 𝗳𝗶𝗹𝗹 𝗼𝘂𝘁 𝗼𝘂𝗿 𝘀𝗵𝗼𝗿𝘁 𝘁𝗿𝗮𝗶𝗻𝗶𝗻𝗴 𝗶𝗻𝘁𝗲𝗿𝗲𝘀𝘁 𝗳𝗼𝗿𝗺 here: