
In my last post, we explored the concepts of recombination frequency and genetic distance. Building on that, let’s look now at 𝗴𝗲𝗻𝗲𝘁𝗶𝗰 𝗺𝗮𝗽𝗽𝗶𝗻𝗴—a powerful technique that translates these concepts into a practical roadmap of a genome. Genetic mapping is essential for understanding gene linkage and distance, particularly in the context of establishing associations between molecular markers and gene traits.
🛠️How it works!
We begin by analyzing inheritance patterns to identify which genes and markers are linked—meaning that they are not inherited independently but are located on the same chromosome. Once we identifyed these linked markers, we organize them into 𝗹𝗶𝗻𝗸𝗮𝗴𝗲 𝗴𝗿𝗼𝘂𝗽𝘀. These groups represent sets of markers that are linked to each other and typically correspond to the chromosomes of the species we are working with.
Once linkage groups are established, we use recombination frequency to 𝗼𝗿𝗱𝗲𝗿 𝘁𝗵𝗲 𝗺𝗮𝗿𝗸𝗲𝗿𝘀 𝘄𝗶𝘁𝗵𝗶𝗻 𝗲𝗮𝗰𝗵 𝗴𝗿𝗼𝘂𝗽 𝗮𝗻𝗱 𝗱𝗲𝘁𝗲𝗿𝗺𝗶𝗻𝗲 𝘁𝗵𝗲𝗶𝗿 𝗴𝗲𝗻𝗲𝘁𝗶𝗰 𝗱𝗶𝘀𝘁𝗮𝗻𝗰𝗲. The rule says that 1% recombination frequency between two genes or genetic markers is equal to 1 cM (centiMorgans) of genetic distance. The closer these two marker are located, the less frequently they will recombine.
💡 An Arithmetic Example: Genetic Mapping via Testcross
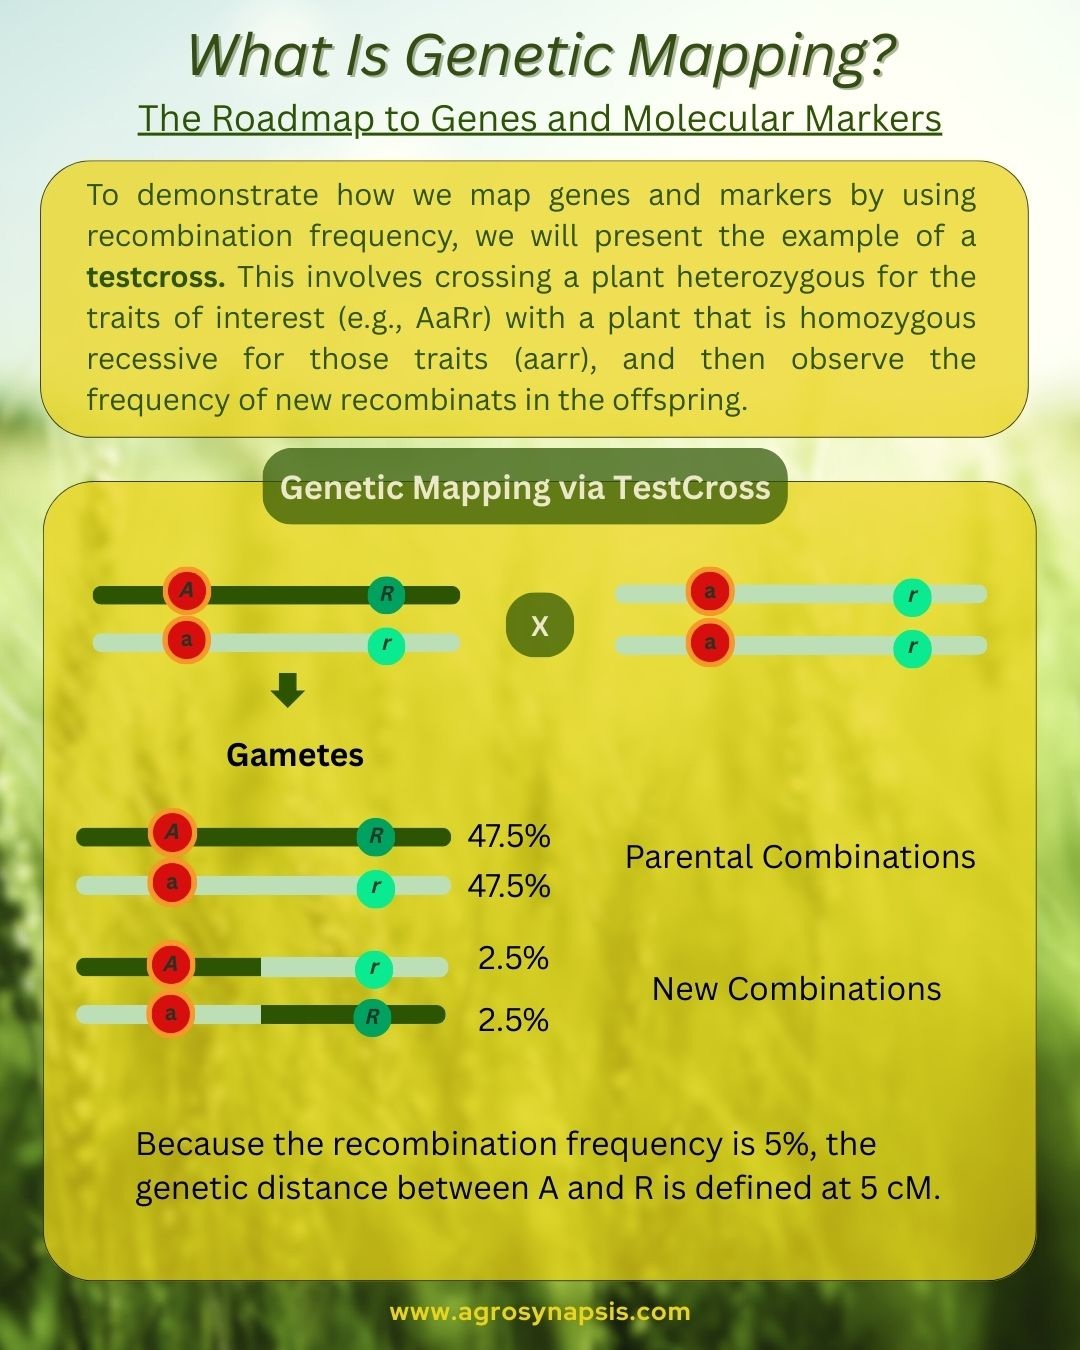
To determine recombination frequency and map genes, geneticists often use a 𝘁𝗲𝘀𝘁𝗰𝗿𝗼𝘀𝘀. This involves crossing a plant heterozygous for the traits of interest (e.g., AaBb) with a plant that is homozygous recessive for those traits (aabb).
The 𝘁𝗲𝘀𝘁𝗰𝗿𝗼𝘀𝘀 is crucial because the homozygous recessive parent (aabb) only produces ab gametes, allowing us to directly observe the gametes produced by the heterozygous parent (AaBb) in the offspring’s phenotype.
Imagine we cross a parent AaBb with a parent aabb, where the genes A and B are linked and show the following allelic combinations in the offspring:
Parental Combinations (High Frequency):
AaBb (inherited A and B together)
aabb (inherited a and b together)
Total frequency: 95% (47.5% for each type)
Recombinant Combinations (Low Frequency):
Aabb (inherited A and b)
aaBb (inherited a and B)
Total frequency: 5% (2.5% for each type)
Because the recombination frequency is 5%, the genetic distance between A and B is defined at 5 cM. When we repeat this job for several markers, we are able to organise them into linkage groups, calculate their genetic distance and construct a linkage map.
In other words, genetic mapping is the process of buidling 𝗴𝗲𝗻𝗲𝘁𝗶𝗰 𝗺𝗮𝗽𝘀, a concept we will explore in an upcoming post.
🎯 If you find our content helpful and want to strengthen your skills, AgroSynapsis invites you to fill out our short training interest form. By doing—and you’ll be the first to receive early access and special discounts for future sessions.
👉 https://lnkd.in/g3tApqPz
Genetic Mapping: The Roadmap to Genes and Molecular Markers
by