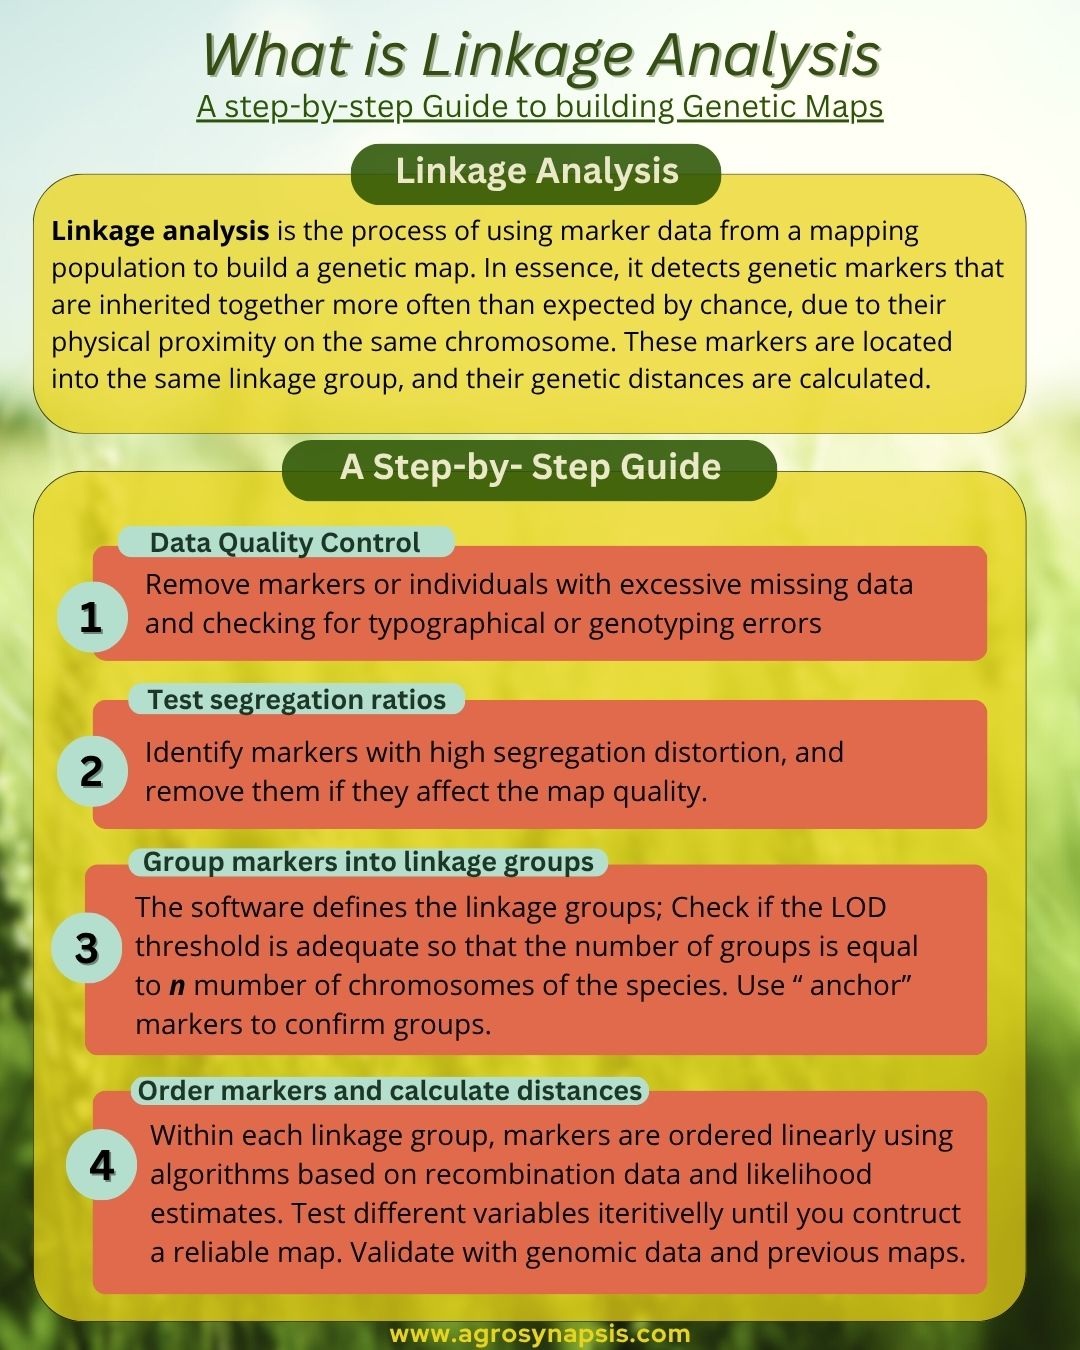
𝗟𝗶𝗻𝗸𝗮𝗴𝗲 𝗮𝗻𝗮𝗹𝘆𝘀𝗶𝘀 is the process of using marker data from a mapping population to build a genetic map.
In essence, it detects genetic markers that are inherited together more often than expected by chance, due to their physical proximity on the same chromosome. These markers are grouped into the same linkage group, and their genetic distances are calculated.
This process is fully computerized and implemented through specialized R packages (e.g., qtl, OneMap) or user-interface software such as JoinMap or IciMapping.
💡 Data Quality Control
Before letting the software do the heavy lifting, we must first clean the dataset. This involves removing markers or individuals with excessive missing data and checking for typographical or genotyping errors. As noted by several authors, even a small proportion of errors or missing data can substantially affect the accuracy, order, and length of a linkage map.
Once the data are ready, the software typically follows a three-step procedure:
1️⃣ Test segregation ratios – Each marker is compared with the expected Mendelian inheritance pattern. Markers showing segregation distortion should be carefully evaluated, since their inclusion may affect the quality of the map.
2️⃣ Group markers into linkage groups – Markers are assigned to linkage groups using the odds of linkage, expressed as the LOD score (logarithm of odds). The LOD measures the likelihood that two markers are linked at a given recombination fraction versus unlinked; higher LOD values indicate stronger evidence of linkage. Adjusting the LOD threshold is critical for generating the correct number of linkage groups (correspong to the haploid number of chromosomes of the species).
3️⃣ Order markers and calculate distances – Within each linkage group, markers are ordered linearly using algorithms based on recombination data and likelihood estimates. Recombination frequencies are then converted into genetic distances (centiMorgans, cM) using mapping functions such as Haldane or Kosambi, providing the scale of the map.
⚙️ An Iterative Process
Linkage analysis is not a one-shot calculation—it is an iterative process. Thresholds often need to be adjusted, variables tested, and analyses repeated until a map with a stable and biologically meaningful structure is obtained.
The final step is map validation, comparing the resulting map with known physical genome information or previously published maps to ensure reliability.
✨ At AgroSynapsis, we offer training workshops and coaching on topics of molecular breeding, explaining complex concepts with clarity and simplicity.
👉 If you’d like to be informed about our upcoming workshops, and receive early access and discounts, 𝗳𝗶𝗹𝗹 𝗼𝘂𝘁 𝗼𝘂𝗿 𝘀𝗵𝗼𝗿𝘁 𝘁𝗿𝗮𝗶𝗻𝗶𝗻𝗴 𝗶𝗻𝘁𝗲𝗿𝗲𝘀𝘁 𝗳𝗼𝗿𝗺 here:
https://lnkd.in/g3tApqPz
Linkage Analysis: a Step-by-Step Guide to Building Genetic Maps
by