TOPICS
- Independent Assortment (9:3:3:1, No epistasis)
- Recessive epistasis (9:3:4)
- Dominant epistasis (12:3:1)
- Dominant and recessive (inhibitory) epistasis (13:3)
- Duplicate recessive epistasis (9:7)
- Duplicate dominant epistasis (15:1)
- Polymeric gene interaction (9:6:1)
Introduction
Gene interactions play a crucial role in determining the traits of an organism. When alleles of the same gene interact, this can result in dominance, incomplete dominance, or co-dominance—collectively referred to as intra-allelic interactions.
However, when different genes influence the same trait and interact with each other, this phenomenon is known as inter-allelic interaction or epistasis. In epistasis, one gene, called the epistatic gene, can mask or suppress the effect of another gene, known as the hypostatic gene.
These gene interactions often modify the classic Mendelian ratios observed in dihybrid or trihybrid crosses, leading to altered segregation patterns in the F₂ generation. Understanding epistasis is essential for interpreting complex inheritance patterns in breeding and genetics.
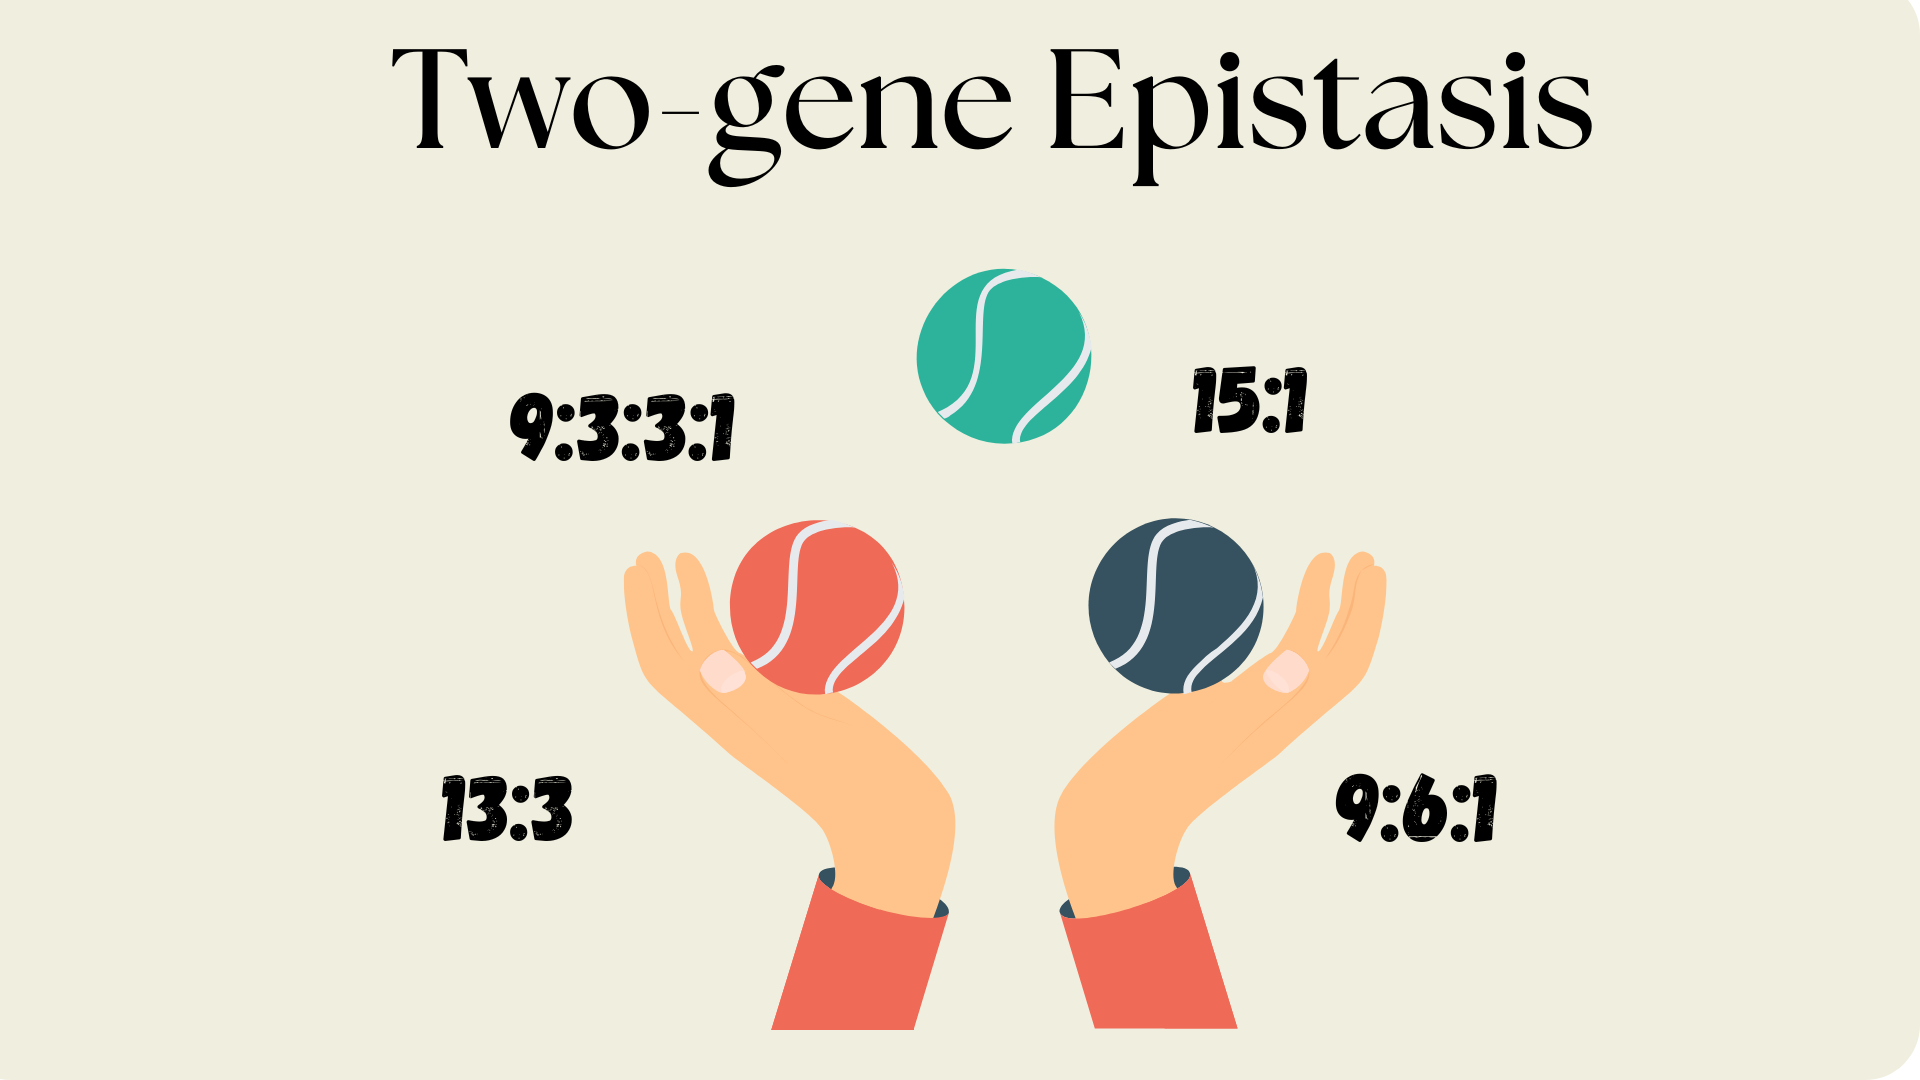
In this article, we explore the main types of two-gene epistasis and how they modify the classical 9:3:3:1 Mendelian ratio observed under independent assortment, leading to the following characteristic F₂ segregation patterns:
- Independent Assortment (9:3:3:1, No epistasis)
- Recessive epistasis (9:3:4)
- Dominant epistasis (12:3:1)
- Dominant and recessive (inhibitory) epistasis (13:3)
- Duplicate recessive epistasis (9:7)
- Duplicate dominant epistasis (15:1)
- Polymeric gene interaction (9:6:1)
For each case, we explain the genetic interaction and illustrate it with the corresponding Punnett square to show how these ratios arise.
🧩 What is a Punnett Square?
Punnett square is a simple but powerful diagram used in genetics to predict the possible combinations of alleles in offspring, based on the genotypes of the parents. It helps visualize how genes segregate and combine, making it easier to understand inheritance patterns—including those modified by epistasis.
In the context of epistatic interactions, the Punnett square does more than show genotypes—it also helps explain how phenotypes arise when two genes interact. That’s why we’ve included a Punnett square for each genetic model presented in this article, to clarify how the ratios like 9:3:4, 12:3:1, or 15:1 come about.
But now let’s go through every genetic model:
Dihybrid ratio (9:3:3:1)
A classical example of two genes influencing a single phenotypic trait—comb shape in poultry—was described by Bateson and Punnett. In this case, two independently assorting genes (R and P) determine the type of comb in chickens, producing four distinct phenotypes in the F₂ generation in a 9:3:3:1 ratio.
Trait: comb shape in poultry
Phenotypes: rose comb, pea comb, a single comb and walnut comb.
Gene Function
- R = Dominant allele for rose comb
- r = Recessive allele (no rose comb)
- P = Dominant allele for pea comb
- p = Recessive allele (no pea comb)
Phenotypes and Genotypes

(Note: “–” indicates the presence of either homozygous dominant or heterozygous allele)
Here’s the Punnett square for the dihybrid cross RrPp × RrPp, showing both the genotype and the corresponding phenotype in each cell.

Duplicate recessive epistasis (Complementary gene action 9:7)
A classical example of two genes influencing a single phenotypic trait through complementary gene interaction was described in sweet pea flower color. In this case, two independently assorting genes (A and B) are both required to produce purple color. If either gene is homozygous recessive, the result is white flowers. This leads to two phenotypes in the F₂ generation in a 9:7 ratio.
Trait: Flower color in sweet pea
Phenotypes: Purple flower, white flower
Gene Function
- A = Dominant allele required for pigment production
- a = Recessive allele; lacks function
- B = Dominant allele required for pigment production
- b = Recessive allele; lacks function
Phenotypes and Genotypes

(Note: “–” indicates either homozygous dominant or heterozygous allele)
Punnett square (AaBb x AaBb)

Dihybrid ratio (15:1) — Duplicate Dominant Epistasis
A classical example of two genes controlling a single trait by duplicate dominant epistasis is seen in the awn character of rice. In this model, a dominant allele at either locus (A or B) is sufficient to produce the awned phenotype. The awnless phenotype appears only when both genes are homozygous recessive (aabb). This results in a 15:1 phenotypic ratio in the F₂ generation.
Trait: Presence or absence of awns in rice
Phenotypes: Awned, Awnless
Gene Function
- A = Dominant allele producing awns
- a = Recessive allele (no awn function)
- B = Another dominant allele producing awns
- b = Recessive allele (no awn function)
Phenotypes and Genotypes

(Note: “–” indicates either homozygous dominant or heterozygous allele; Image from: Masoumi et al. (2020). CIGR Journal, 22(2). )
Punnett square (AaBb x AaBb)

Dihybrid Ratio (13:3) — Inhibitory Gene Action (Dominant Epistasis)
In inhibitory gene interaction, also known as dominant inhibitory epistasis, a dominant allele at one locus (I) inhibits the expression of a gene at a second locus (P), regardless of whether that second gene is dominant or recessive. This results in a 13:3 phenotypic ratio in the F₂ generation.
Trait: Anthocyanin pigmentation (green vs. purple color) in rice
Phenotypes: Green plant, Purple plant
Gene Function
- I = Dominant inhibitory allele; suppresses pigmentation (green color)
- i = Recessive allele; no inhibition
- P = Dominant pigment-producing allele; required for purple color
- p = Recessive allele; no pigment production
Phenotypes and Genotypes

(Note: “–” indicates either homozygous dominant or heterozygous allele; Image adapted from: Ma, X. et al. (2021). Plant Diversity, 43(5), 308–31)
Punnett square (IiPp x IiPp)

Dihybrid Ratio (9:6:1) — Additive Factors (Polymeric Gene Action)
In polymeric gene interaction, also known as additive gene action, two dominant genes (A and B) independently contribute the same phenotype, but when both are present, their effects are cumulative, producing an enhanced phenotype. Each gene shows complete dominance. This results in a 9:6:1 phenotypic ratio in the F₂ generation.
Trait: Awn length in barley
Phenotypes: Long awns, Medium awns, Awnless
Gene Function
- A = Dominant allele contributing to awn length
- a = Recessive allele (no effect on awn)
- B = Another dominant allele contributing to awn length
- b = Recessive allele (no effect on awn)
Phenotypes and Genotypes

(Note: “–” indicates either homozygous dominant or heterozygous allele; Image source: Luong et al. (2022), The Rice Journal.)
Punnett Square (AaBb × AaBb)

Dihybrid Ratio (12:3:1) — Dominant Epistasis
In dominant epistasis, a dominant allele at one gene locus (W) masks the expression of alleles at another gene locus (G). This modifies the classical 9:3:3:1 dihybrid ratio to 12:3:1 in the F₂ generation.
Trait: Fruit color in summer squash
Phenotypes: White, Yellow, Green
Gene Function
- W = Dominant epistatic allele for white color
- w = Recessive allele (no epistatic effect)
- G = Dominant allele for yellow color
- g = Recessive allele (no yellow pigment)
Phenotypes and Genotypes

(Note: “–” indicates either homozygous dominant or heterozygous allele)
Punnett Square (WwGg × WwGg)

Supplementary Gene Action (Recessive Epistasis, 9:3:4)
In supplementary gene action, one dominant gene controls the main phenotypic effect, while the other gene, though dominant, modifies the expression of the first gene without having a visible effect on its own. This interaction leads to a modified phenotypic ratio in the F₂ generation.
Trait: Labrador coat color
Phenotypes: black coat,brown coat,pigment, no pigment
Gene Function
- B = dominant allele for black coat color
- b = recessive allele for brown coat color
- E = dominant allele allowing pigment deposition
- e = recessive allele preventing pigment deposition (epistatic to B gene)
Phenotypes and Genotypes

(Note: “–” indicates either homozygous dominant or heterozygous allele)
Punnett Square (BbEe × BbEe)

To wrap up, understanding epistatic F₂ segregation ratios is key to interpreting complex genetic interactions and guiding early-generation selection. At AgroSynapsis, we support breeders in identifying the genetic model behind observed phenotypic classes—starting with our free online tool, EpiTrack 🧬. Recognizing the correct epistatic interaction helps breeders design their breeding populations and choose the right parent lines in a way that ensures achieving the desirable phenotypes by the end of the breeding program.
Try EpiTrack today and let your data drive smarter breeding decisions! 🚀